
Since this post is a snapshot in time. I recommend that you download a copy of the book which is updated frequently to improve and expand the content.
---------------------------------------
This is the second of three posts working through a project looking at Measuring Recording and Exploring system information from and with the Raspberry Pi.Record
To record this data we will use a Python program that checks all the the values and writes them into our MySQL database along with the current time stamp.
Our Python program will only write a single group of readings to the database and we will execute the program at a regular interval using a cron job in the same way as the multiple temperature sensor project.
Database preparation
First we will set up our database table that will store our data.
Using the phpMyAdmin web interface that we set up, log on using the administrator (root) account and select the ‘measurements’ database that we created as part of the initial set-up.
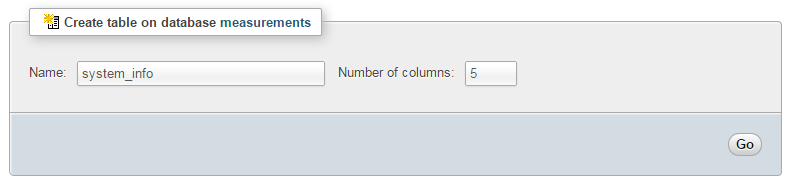 |
| Create the MySQL Table |
Enter in the name of the table and the number of columns that we are going to use for our measured values. In the screenshot above we can see that the name of the table is ‘system_info’ and the number of columns is ‘5’.
We will use five columns so that we can store our four readings (system load, used ram, used disk and CPU temperature).
Once we click on ‘Go’ we are presented with a list of options to configure our table’s columns. Again, we are going to keep the process as simple as practical and while we could be more economical with our data type selections, we’ll err on the side of simplicity.
 |
| Configure the MySQL Table Columns |
For the first column we can enter the name of the ‘Column’ as ‘load’ with a type of ‘REAL’. Our second column is ‘ram’ and our third is ‘disk’. Both of these should have a type of ‘TINYINT’. Then we have a column for ‘temperature’ and the type is ‘FLOAT’. Lastly we include the column ‘dtg’ (short for date time group) the type as ‘TIMESTAMP’ and the ‘Default’ value as ‘CURRENT_TIMESTAMP’.
 |
| Save the MySQL Table Columns |
Scroll down a little and click on the ‘Save’ button and we’re done.
 | Why did we choose those particular settings for our table?
Our system load readings will vary from 0 up and will hopefully spend most of their time as a decimal less than 1. However, sometimes it will exceed this. Our ‘temperature’ readings will also be a decimal value. Assigning them both a REAL data type allows us to recorded values where the number can have a maximum of 65 Digits, with 30 digits after decimal point (that should be plenty).
Both ‘ram’ and ‘disk’ will be integers, but since they will both be percentage values which will not exceed 100% we can use the ‘TINYINT’ type which allows values from -128 to 127 (or 0 to 255 if they’re unsigned).
Our ‘dtg’ column needs to store a value of time that includes the date and the time, so the advantage of selecting TIMESTAMP in this case is that we can select the default value to be the current time which means that when we write our data to the table we only need to write the ‘temperature’ and ‘sensor_id’ values and the ‘dtg’ will be entered automatically for us. The disadvantage of using ‘TIMESTAMP’ is that it has a more limited range than DATETIME. TIMESTAMP can only have a range between ‘1970-01-01 00:00:01’ to ‘2038-01-19 03:14:07’.
|
Record the system information values
The following Python code is a script which allows us to check the system readings from the Raspberry Pi and writes them to our database.
The full code can be found in the code samples bundled with this book (system_info.py).
#!/usr/bin/python
# -*- coding: utf-8 -*-

import subprocess
import os
import MySQLdb as mdb

# Function for storing readings into MySQL
def insertDB(system_load, ram, disk, temperature):

  try:
    con = mdb.connect('localhost',
                      'pi_insert',
                      'xxxxxxxxxx',
                      'measurements');
    cursor = con.cursor()

    sql = "INSERT INTO system_info(`load`,`ram`,`disk`,`temperature`) \
    VALUES ('%s', '%s', '%s', '%s')" % \
    (system_load, ram, disk, temperature)
    cursor.execute(sql)
    con.commit()

    con.close()

  except mdb.Error, e:
    con.rollback()
    print "Error %d: %s" % (e.args[0],e.args[1])
    sys.exit(1)

# returns the system load over the past minute
def get_load():
    try:
        s = subprocess.check_output(["cat","/proc/loadavg"])
        return float(s.split()[0])
    except:
        return 0

# Returns the used ram as a percentage of the total available
def get_ram():
    try:
        s = subprocess.check_output(["free","-m"])
        lines = s.split("\n")
        used_mem = float(lines[1].split()[2])
        total_mem = float(lines[1].split()[1])
        return (int((used_mem/total_mem)*100))
    except:
        return 0

# Returns the percentage used disk space on the /dev/root partition
def get_disk():
    try:
        s = subprocess.check_output(["df","/dev/root"])
        lines = s.split("\n")
        return int(lines[1].split("%")[0].split()[4])
    except:
        return 0

# Returns the temperature in degrees C of the CPU
def get_temperature():
    try:
        dir_path="/opt/vc/bin/vcgencmd"
        s = subprocess.check_output([dir_path,"measure_temp"])
        return float(s.split("=")[1][:-3])
    except:
        return 0

got_load = str(get_load())
got_ram = str(get_ram())
got_disk = str(get_disk())
got_temperature = str(get_temperature())

insertDB(got_load, got_ram, got_disk, got_temperature)
This script can be saved in our home directory (
/home/pi) and can be run by typing;
While we won’t see much happening at the command line, if we use our web browser to go to the phpMyAdmin interface and select the ‘measurements’ database and then the ‘system_info’ table we will see a range of information for the different system parameters and their associated time of reading.
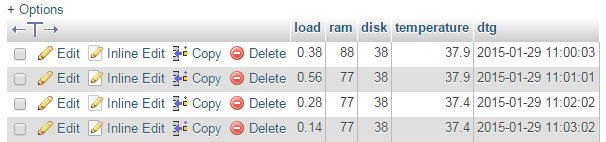 |
| System info in MySQL |
As with our previous project recording multiple temperature points, this script only records a single line of data whenever it is run. To make the collection more regular we will put in a cron job later to regularly check and record.
Code Explanation
The script starts by importing the modules that it’s going to use for the process of reading and recording the temperature measurements;
import subprocess
import os
import MySQLdb as mdb
 |
Python code in one module gains access to the code in another module by the process of importing it. The
import statement invokes the process and combines two operations; it searches for the named module, then it binds the results of that search to a name in the local scope. |
We then declare the function that will insert the readings into the MySQL database;
def insertDB(system_load, ram, disk, temperature):

  try:
    con = mdb.connect('localhost',
                      'pi_insert',
                      'xxxxxxxxxx',
                      'measurements');
    cursor = con.cursor()

    sql = "INSERT INTO system_info(`load`,`ram`,`disk`,`temperature`) \
    VALUES ('%s', '%s', '%s', '%s')" % \
    (system_load, ram, disk, temperature)
    cursor.execute(sql)
    con.commit()

    con.close()

  except mdb.Error, e:
    con.rollback()
    print "Error %d: %s" % (e.args[0],e.args[1])
    sys.exit(1)
This is a fairly simple insert of the values we will be collecting into the database.
Then we have our four functions that collect our system information;
load
As described in the earlier section we will be extracting information out of the
/proc/loadavg file. Specifically we will extract the average load for the last minute. We are going to accomplish this using the following code;def get_load():
try:
s = subprocess.check_output(["cat","/proc/loadavg"])
return float(s.split()[0])
except:
return 0
The code employs the
subprocess module (which we loaded at the start of the script) which in this case is using the check_outputconvenience function which will run the command (cat) and the argument (/proc/loadavg). It will return the output as a string (0.14 0.11 0.13 1/196 16991) that we can then manipulate. This string is stored in the variable s.
The following line
returns the value from the function. The value is a floating number (decimal) and we are taking the first part (split()[0]) of the string (s) which by default is being split on any whitespace. In the case of our example string (0.14 0.11 0.13 1/196 16991) that would return the value 0.14.
If there is a problem retrieving the number it will be set to 0 (
except: return 0).ram
As described in the earlier section we will be extracting information out of the results from running the
free command with the -margument. Specifically we will extract the used memory and total memory values and convert them to a percentage. We are going to accomplish this using the following code;def get_ram():
try:
s = subprocess.check_output(["free","-m"])
lines = s.split("\n")
used_mem = float(lines[1].split()[2])
total_mem = float(lines[1].split()[1])
return (int((used_mem/total_mem)*100))
except:
return 0
The code employs the
subprocess module (which we loaded at the start of the script) which in this case is using the check_outputconvenience function which will run the command (free) and the argument (-m). It will store the returned multi-line output showing memory usage in the variable s. The output from this command (if it is run from the command line) would look a little like this; total used free shared buffers cached
Mem: 437 385 51 0 85 197
-/+ buffers/cache: 102 335
Swap: 99 0 99
We then split that output string line by line and store the result in the array
lines using lines = s.split("\n").
Then we find the used and total memory by looking at the second line down (
lines[1]) and extracting the appropriate column (split()[2] for used and split()[1] for total).
Then it’s just some simple math to turn the memory variables (
used_mem and total_mem) into a percentage.
If there is a problem retrieving the number it will be set to 0 (
except: return 0).disk
As described in the earlier section we will be extracting information out of the results from running the
df command with the /dev/rootargument. Specifically we will extract the percentage used value. We will accomplish this using the following code;def get_disk():
try:
s = subprocess.check_output(["df","/dev/root"])
lines = s.split("\n")
return int(lines[1].split("%")[0].split()[4])
except:
return 0
The code employs the
subprocess module (which we loaded at the start of the script) which in this case is using the check_outputconvenience function which will run the command (df) and the argument (/dev/root). It will store the returned multi-line output showing disk partition usage data in the variable s.
We then split that output string line by line and store the result in the array
lines using lines = s.split("\n").
Then, using the second line down (
lines[1])…/dev/root 7513804 2671756 4486552 38% /
… we extracting the percentage column (
split()[4]) and remove the percentage sign from the number (split("%")[0]). The final value is returned as an integer.
If there is a problem retrieving the number it will be set to 0 (
except: return 0).temperature
As described in the earlier section we will be extracting the temperature of the Raspberry Pis CPU the
vcgencmd command with themeasure_temp argument. We will accomplish this using the following code;def get_temperature():
try:
dir_path="/opt/vc/bin/vcgencmd"
s = subprocess.check_output([dir_path,"measure_temp"])
return float(s.split("=")[1][:-3])
except:
return 0
The code employs the
subprocess module (which we loaded at the start of the script) which in this case is using the check_outputconvenience function which will run the command (vcgencmd) and the argument (/dev/root) The vcgencmd command is referenced by its full path name which is initially stored as the variable dir_path and is then used in the subprocess command (this is only done for the convenience of not causing a line break in the code for the book by the way). The measure_temp argument returns the temperature in a human readable string (temp=39.0'C) which is stored in the variable s.
We are extracting the percentage value by splitting the line on the equals sign (
split("=")), taking the text after the equals sign and trimming off the extra that is not required ([1][:-3]). The final value is returned as an real number.
If there is a problem retrieving the number it will be set to 0 (
except: return 0).Main program
The main part of the program (if you can call it that) consists of only the following lines;
got_load = str(get_load())
got_ram = str(get_ram())
got_disk = str(get_disk())
got_temperature = str(get_temperature())

insertDB(got_load, got_ram, got_disk, got_temperature)
They serve to retrieve the value from each of our measurement functions and to then send the results to the function that writes the values to the database.
Recording data on a regular basis with cron
As mentioned earlier, while our code is a thing of beauty, it only records a single entry for each sensor every time it is run.
What we need to implement is a schedule so that at a regular time, the program is run. This is achieved using
cron via the crontab. While we will cover the requirements for this project here, you can read more about the crontab in the Glossary.
To set up our schedule we need to edit the
crontab file. This is is done using the following command;
Once run it will open the crontab in the nano editor. We want to add in an entry at the end of the file that looks like the following;
*/1 * * * * /usr/bin/python /home/pi/system_info.py
This instructs the computer that exert minute of every hour of every day of every month we run the command
/usr/bin/python /home/pi/system_info.py (which if we were at the command line in the pi home directory we would run as python system_info.py, but since we can’t guarantee where we will be when running the script, we are supplying the full path to the python command and the system_info.pyscript.
Save the file and the computer will start running the program on its designated schedule and we will have sensor entries written to our database every minute.
The post above (and heaps of other stuff) is in the book 'Raspberry Pi: Measure, Record, Explore' that can be downloaded for free (or donate if you really want to :-)).
No comments:
Post a Comment