
Since this post is a snapshot in time. I recommend that you download a copy of the book which is updated frequently to improve and expand the content.
---------------------------------------
This is the second part of the third post working through a project looking at Measuring Recording and Exploring system information from and with the Raspberry Pi.
As mentioned earlier, our html code requires JSON formatted data to be gathered and we have named the file that will do this job for us
sys_info.php. This file is per the code below and it can be downloaded as sys_info.php with the downloads available with the book.
We will want to put this code in the same directory as the
sys_info.py and bullet.js files, so they can find each other easily.$hostname = 'localhost';
$username = 'pi_select';
$password = 'xxxxxxxxxx';
try {
$dbh = new PDO("mysql:host=$hostname;dbname=measurements",
$username, $password);
/*** The SQL SELECT statement ***/
$sth = $dbh->prepare("
       SELECT *
       FROM `system_info`
       ORDER BY `dtg` DESC
       LIMIT 0,1
");
$sth->execute();
/* Fetch all of the remaining rows in the result set */
$result = $sth->fetchAll(PDO::FETCH_ASSOC);
/*** close the database connection ***/
$dbh = null;
}
catch(PDOException $e)
{
echo $e->getMessage();
}
$bullet_json[0]['title'] = "CPU Load";
$bullet_json[0]['subtitle'] = "System load";
$bullet_json[0]['ranges'] = array(0.75,1.0,2);
$bullet_json[0]['measures'] = array($result[0]['load']);
$bullet_json[0]['markers'] = array(1.1);
$bullet_json[1]['title'] = "Memory Used";
$bullet_json[1]['subtitle'] = "%";
$bullet_json[1]['ranges'] = array(85,95,100);
$bullet_json[1]['measures'] = array($result[0]['ram']);
$bullet_json[1]['markers'] = array(75);
$bullet_json[2]['title'] = "Disk Used";
$bullet_json[2]['subtitle'] = "%";
$bullet_json[2]['ranges'] = array(85,95,100);
$bullet_json[2]['measures'] = array($result[0]['disk']);
$bullet_json[2]['markers'] = array(50);
$bullet_json[3]['title'] = "CPU Temperature";
$bullet_json[3]['subtitle'] = "Degrees C";
$bullet_json[3]['ranges'] = array(40,60,80);
$bullet_json[3]['measures'] = array($result[0]['temperature']);
$bullet_json[3]['markers'] = array(50);
echo json_encode($bullet_json);
The PHP block at the start of the code is mostly the same as our example code for our single temperature measurement project. The difference however is in the select statement.
SELECT *
FROM `system_info`
ORDER BY `dtg` DESC
LIMIT 0,1
It is selecting all the columns in our table, but by ordering the rows by date/time with the most recent at the top and then limiting the returned rows to only one, we get the single, latest row of data returned.
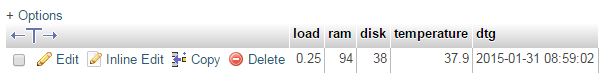 |
| Returned system data |
Most of the remainder of the script assigns the appropriate values to our array of data
bullet_json.
If we consider the required format of our JSON data…
[
  {
    "title":"CPU Load",
    "subtitle":"System Load",
    "ranges":[0.75,1,2],
    "measures":[0.17],
    "markers":[1.1]
  }
]
…we can see that in our code, we are adding in our
title…$bullet_json[0]['title'] = "CPU Load";
… our
subtitle…$bullet_json[0]['subtitle'] = "System load";
… our
ranges…$bullet_json[0]['ranges'] = array(0.75,1.0,2);
… our system load value as returned from the MySQL query…
$bullet_json[0]['measures'] = array($result[0]['load']);
… and our marker(s).
$bullet_json[0]['markers'] = array(1.1);
This data is added for each chart that we will have displayed as a separate element in the
bullet_json array.
Finally, we echo our JSON encoded data so that when
sys_info.php is called, all d3.js ‘sees’ is correctly formatted data.echo json_encode($bullet_json);
Now every 60 seconds, the d3.js code in the
sys_info.html script calls the sys_info.php script that queries the MySQL database and gathers our latest system information. That information is collated and formatted and converted into a visual display that will update in a smooth ballet of motion.
As a way of testing that this portion of the code is working correctly, you can use your browser from an external computer and navigate to the
sys_info.php file. This will print out the JSON values directly in your browser window.The post above (and heaps of other stuff) is in the book 'Raspberry Pi: Measure, Record, Explore' that can be downloaded for free (or donate if you really want to :-)).
No comments:
Post a Comment