
One of the points of difference that I wanted to make was to have the book available for free. The idea being that I would learn about d3.js while writing and people could hopefully derive some benefit at the same time. The price shouldn't be a barrier to the decision about whether a person downloads the book or not (I'm not preaching this as a model for everyone, but it suits me).
Leanpub's service fitted this approach perfectly. A user could download the book and they could do so for free or donate if they felt like it. To do this on Leanpub an author simply sets their minimum price for a book to $0 and a recommended price for what they believe will be a reasonable cost.
Over the two years that the book has been available (at time of writing) it has been downloaded almost 19,000 times. I figure that's pretty good and that in some way I've helped the Open Source community.
In the process of implementing a method of measuring and displaying the passage of a cat through a cat-door over time I built a graph that showed events indicated by both date and time on separate axes. It was then that I figured that this would be useful for picking any trends in how people downloaded my books. Luckily Leanpub has an API for accessing the history of book activity and I was able to download it and store it in a database for exploring.
The end result looked a little like this;
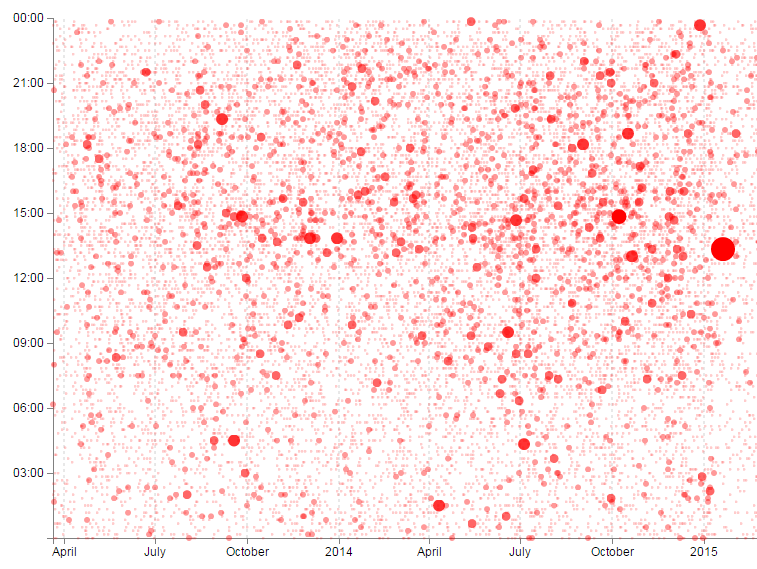
However, there was a marked difference that occurred at the beginning of 2015. There is a distinct reduction in the number of books being downloaded. This was puzzling. I could think of no reason that this had occurred. It wasn't until I used the scatter-plot to show all the instances where people had donated that it dawned on me.

So now we have three interesting factors for the period in question.
- The number of downloads decreased
- The overall amount donated remained the same
- The amount donated became more consistent.
That's when I remembered a change that I had made to the book at the beginning of the year.
I had decided that I would start to move away from adding content to the book and essentially regard it as 'complete' and concentrate on new work. And I made a change....
While the minimum price remains the same at $0 so that people can download for free, I raised the 'recommended' price to $4.99. (it had previously been $1.99).
That one change meant that fewer people downloaded the book.
It was still free, you downloaded it in the same way, but the recommended pricing influenced how many people downloaded a free book.
There could be a bazillion reasons for this I'm sure. My personal favorite was that when the book was presented on the web page, the button that you press to download the book used the words 'Buy Book' (or similar). My theory is that at $1.99 people were more inclined to click the button and then reduce the amount donated to $0 than if the presented price was $4.99.
Either way it was a really interesting moment. So I made another change.....
I left the minimum price at $0 but changed the recommended price to $0. When you do this the button to download changes to 'Get your free eBook' (or similar). The updated scatter-plot with other graphical goodness shows the $4.99 gap and the subsequent change after reducing the recommended price to $0.

If you're interested in the graph you can find the code for it and the graph here. I hope to add the graph and a brief description of how it does it's thing to the blog and the book in the near future.
Awesome post, Malcolm! I have also developed and sold a book on Leanpub (https://leanpub.com/ElectricFertilizerBook), currently off leanpub while I wait for kdp direct to expire. This method could be a great way to help determine optimal pricing.
ReplyDelete