Aim
The aim of the project is to provide visibility of when the pump from the outflow chamber of a septic system is operating. Then if it is running for too long we want to be sent an alert to notify us as this is a potential indicator of a problem (blockage leading to overflow).
Method
The method that we will use to achieve this will be to measure the current flowing to the pump and to make that data available to a Prometheus / Grafana instance that will then be used for visibility / alerting.
Requirements
Materials
- Current Sensor: An ACS712 based module. We'll use a 5A unit since the pump is not expected to exceed 500W.
- Analog to Digital Converter: The ADS1015 will be more than sufficient for our needs.
- Enclosures: The current sensor must be protected to prevent contact with the live terminals. The A2D converter should be protected where possible.
- Voltage divider: We will use three 1k Ohm resistors.
- Wiring: Hook up wires with female Dupont connectors and appropriate wiring for the load connection (I used 2.5mm cabling)
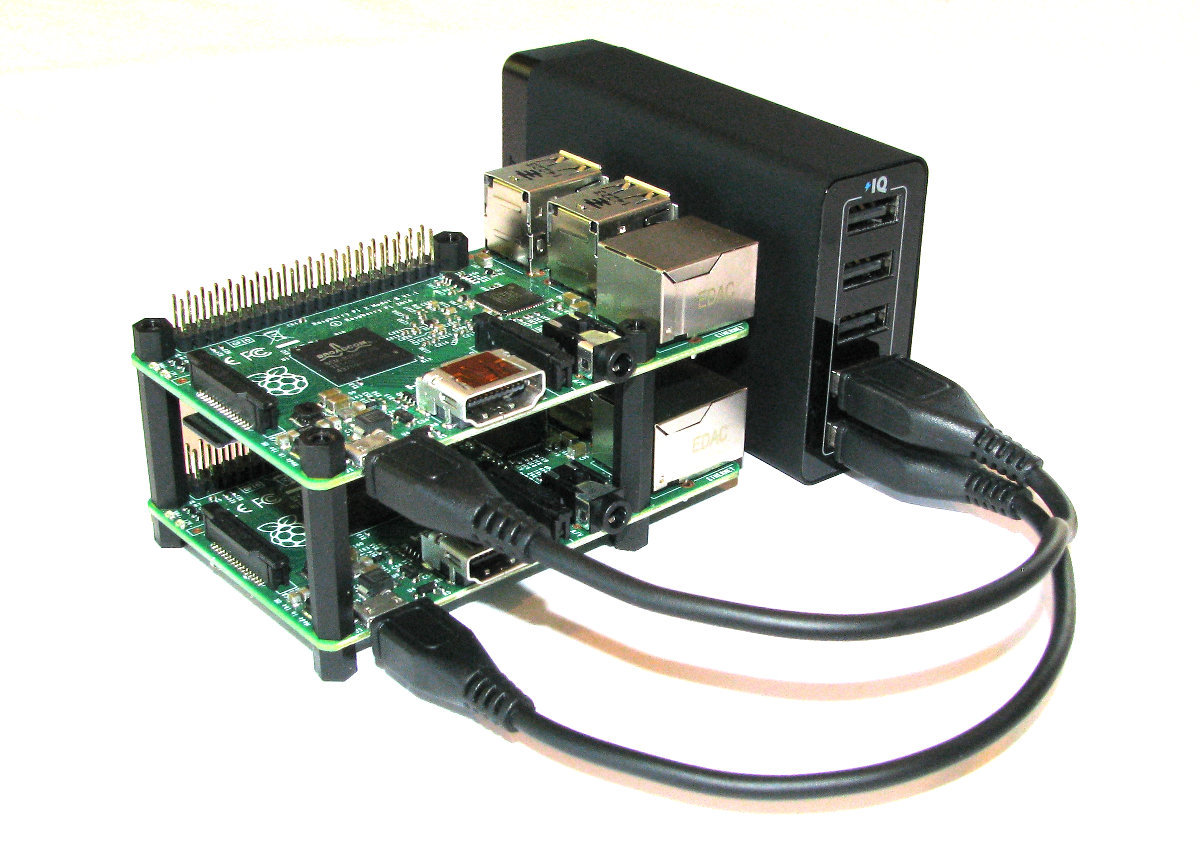
- Compute: Raspberry Pi Zero W with case, micro SD Card, case and headers.
Description
This project is one that has been born out of necessity. Our septic system is a good unit that operates as required however, there have been a few occasions where we have had the outflow from the final chamber blocked for one reason or another (and there have been a variation here). The end result of this has been the increase in water level in the final chamber. In two cases this has not been caught in spite of the inbuilt alarm (that uses a float switch and an annunciator in the garage) resulting in the septic system flooding (not good).
To add some redundancy to the system and to provide remote alerting capability I decided to add my own alerting system.
I considered a couple of different options including;
- Looking at the outflow from the septic tank and measuring the volume of water pumped. While possible, this option involves moving parts in a portion of the system that is space constrained and the method for alerting would involve determining the absence of a thing over a period of time that would be indeterminate.
- An additional (but different) float switch in the final chamber. This was practical and do-able, but the environment is fairly harsh (water, humidity, 'stuff') and it would have been an alert that occurs later in the process of failure (similar to the default installed alarm which once had its float get stuck and failed to alert properly)
- Current sensing for the pump operation. This has the advantage of providing very quick feedback if there is a problem and keeps any measurement in a 'cleaner' space. The down side is that this does mean connecting a sensor to a high voltage part of an electrical circuit and therefore requires doing the work within local regulations and taking the appropriate safety precautions.
I opted for the current sensing option since it was the best of the three options in terms of getting a good result (early detection). I have the advantage of being a registered electrical service technician and therefore am able to do the work safely and appropriately.
Equipment
The current sensor we will use is based on the ACS712 Module. I sourced mine from
Banggood, but they are widely available for low cost. This specific one used here is the ACS712ELC-05B which can measure plus or minus 5 Amps corresponding to an analog output of 185 mV/A. The unit is powered from a 5V supply, so we will be connecting it to a 5V output from the Pi and using a voltage divider to reduce the voltage output appropriately for input to the analog to digital converter
If you have access to a 3d printer, you can print an enclosure from the design
here.
To enable the current sensing option we will also need to include a digital to analog converter. This should be a fairly simple task similar to the method used
here for measuring levels from a gas sensor.
If you have access to a 3d printer, you can print an enclosure for the D2A converter from the design
here.
The connection layout is as below (again very similar to the method
here);
Operating System Setup
The installation below was carried out using the Raspbian 'Buster' OS. This is available from the
Raspberry Pi website.
Install the OS onto an SD card and power up the Pi.
The first thing we should do is to configure the Pi appropriately for use. Some of the steps may or may not be needed depending on your circumstances (i.e. will you be using a model Pi with a physical Ethernet connection or Wifi). Where in doubt check out one of the
Raspberry Pi Computing books which will walk through the options.
We can start by running the command;
sudo raspi-config
This will give us access to the options for localisation (WiFi country, time-zone, locale) but most importantly (in this case) for enabling the I2C protocol.
Since the ADS1015 uses the I2C protocol to communicate, we need to load the appropriate kernel support modules onto the Raspberry Pi to allow this to happen.
Since we are using the Raspbian distribution there is a simple method to start the process of configuring the Pi to use the I2C protocol.
On the first page select the Interfacing Options with the arrow keys and then tab to select
Then we select the I2C option for automatic loading of the kernel module;
Would we like the ARM I2C interface to be enabled? Yes we would;
Press 'OK' to acknowledge that the interface is enabled.
Press tab to select 'Finish'.
Once this is done we should do what we should always do when embarking on a fresh install on a Raspberry Pi and that's to update and upgrade the software.
sudo apt-get update
sudo apt-get upgrade
From here, you should look to configuring a static IP address or a WiFi connection if desired. Again, where in doubt check out one of the
Raspberry Pi Computing books for options.
Software Setup
There's still some work to do to get things sorted, especially for the I2C functionality. We need to check the /etc/modules file using:
sudo nano /etc/modules
Where we need to ensure that the following line is at the end of the file:
i2c-dev
Under some circumstances (depending on the kernel version we are using) we would also need to update the /boot/config.txt file. We can do this using;
sudo nano /boot/config.txt
Make sure that the following line is uncommented (the '#' is removed from in front of the line) in the file;
dtparam=i2c_arm=on
Then we should load tools for working with I2C devices using the following command;
sudo apt-get install i2c-tools
... and now we should reboot to load the 'config.txt' file if we changed it earlier
sudo reboot
We can now check to see if our sensor is working using;
sudo i2cdetect -y 1
If we were using an older B model of Raspberry Pi with 256MB of RAM, we would need to use sudo i2cdetect -y 0.
The output should look something like;
pi@raspberrypi ~ $ sudo i2cdetect -y 1
     0  1  2  3  4  5  6  7  8  9  a  b  c  d  e  f
00:          -- -- -- -- -- -- -- -- -- -- -- -- --
10: -- -- -- -- -- -- -- -- -- -- -- -- -- -- -- --
20: -- -- -- -- -- -- -- -- -- -- -- -- -- -- -- --
30: -- -- -- -- -- -- -- -- -- -- -- -- -- -- -- --
40: -- -- -- -- -- -- -- -- 48 -- -- -- -- -- -- --
50: -- -- -- -- -- -- -- -- -- -- -- -- -- -- -- --
60: -- -- -- -- -- -- -- -- -- -- -- -- -- -- -- --
70: -- -- -- -- -- -- -- --
This shows us that we have detected our ADS1015 on address '48' (The ADS1015 can support four different addresses as shown on page 17 of the
data sheet).
Now we want to install the Python libraries designed to read the values from the ADS1015. The library we are going to use was designed specifically to work with the
Adafruit ADS1015/ADS1115 ADCs. In carrying out this library development, Adafruit have invested a considerable amount of time and resources. In return please consider supporting Adafruit and open-source hardware by purchasing products from
Adafruit!
We need to change our default version of Python running on the Pi to Python 3
We can check what version is running by executing the following command;
python --version
If that indicates python 2.x, then we need to change that.
To find out what version of Python 3 is available, run the following
ls /usr/bin/python*
Hopefully you will see a 3.x version.
To change the default python version system-wide we can use the update-alternatives command. First list all available python alternatives;
update-alternatives --list python
There is a good chance that the output will be something like;
update-alternatives: error: no alternatives for python
The above error message means that no python alternatives have been recognised by the update-alternatives command. For this reason we need to update our alternatives table and include both python 2 and 3. Just check that the numbers for the versions in the commands below match the versions that the previous command indicated were installed.
sudo update-alternatives --install /usr/bin/python python /usr/bin/python2.7 1
sudo update-alternatives --install /usr/bin/python python /usr/bin/python3.7 2
The last number on each of the previous lines is the priority, with the higher number being the
highest priority
We can check again by running;
python --version
Now the default version should be Python 3
Install pip3 (for Python 3)
sudo apt-get install python3-pip
Then install setuptools via pip
sudo pip3 install --upgrade setuptools
Install python libraries
pip3 install RPI.GPIO adafruit-blinka
Install the ADC libraries (Note: I occasionally get errors when carrying out the following command and need to re-run it a few times);
sudo pip3 install adafruit-circuitpython-ads1x15
We should now be able to run a simple program to test our sensor.
Create a file called
current.py (using
nano) with the following contents in the home directory (this code can be downloaded from GitHub
here);
#!/usr/bin/python
#encoding:utf-8

import time
import board
import busio
import adafruit_ads1x15.ads1015 as ADS
from adafruit_ads1x15.analog_in import AnalogIn

# Create the I2C bus
i2c = busio.I2C(board.SCL, board.SDA)

# Create the ADC object using the I2C bus
ads = ADS.ADS1015(i2c)
ads.gain = 1

# Create single-ended input on channel 0
chan = AnalogIn(ads, ADS.P0)

# Create differential input between channel 0 and 1
#chan = AnalogIn(ads, ADS.P0, ADS.P1)

print("{:>5}\t{:>5}".format('raw', 'v'))

while True:

  readValue = 0
  maxValue = 0

  for i in range(0,300):
    readValue = chan.value

    if (readValue > maxValue):
      maxValue = readValue

  # write the current integer value to a file
  f = open("current.txt", "w")
  f.write(str(maxValue-6680))
  f.close()

  print("{:>5}\t{:>5.5f}".format(maxValue-6680, chan.voltage))
  time.sleep(0.5)
The file above is essentially the simpletest.py file that Adafruit publish with some amendments.
One of these is that we are only looking at an instantaneous measurement of current. For AC current that could be anywhere along the sine wave in a positive or negative direction.
The solution (which is in the code) is to put in a small loop that determines the maximum value while the loop is running. This indicates the peak value in one direction.
As well as this we can reduce the gain and put in an offset that allows our returned value to read close to zero with no current flowing.
It also includes a small section that writes our current value to a text file. We will use this to contain our value to pass onto Prometheus / Grafana for monitoring later.
Now we can run it using
python current.py
We should see a print out of the values represented by the value of the ADC as an integer and the voltage from the ADC as a floating point value (this is without any current flowing in our sensor).
  raw       v
   -8   0.83203
   56   0.82403
   40   0.82603
   56   0.82803
   56   0.82403
   56   0.82403
And we should also have a file (called 'current.txt') created and updated with the most recent reading.
Create a Service to Run Our Python File
I configured the current measurement as a service as while testing the installation I noticed that the program would occasionally fail at random times. This will allow it to restart if necessary and to start on boot.
The first step in this process is to create a service file which we will call current.service. We will have this in the /etc/systemd/system/ directory.
sudo nano /etc/systemd/system/current.service
[Unit]
Description=Python Current Measurement
After=multi-user.target

[Service]
Restart=on-failure
RestartSec=10s
WorkingDirectory=/home/pi
User=pi
ExecStart=/usr/bin/python /home/pi/current.py

[Install]
WantedBy=multi-user.target
The service file can contain a wide range of configuration information and the case above there is 'Restart' which will restart (duh) the service if it fails and 'ExecStart' which describe where to find python and the current.py executable.
The other important part allows the service to restart if it fails.
Before starting our new service we will need to reload the systemd manager configuration again.
sudo systemctl daemon-reload
Now we can start the current service.
sudo systemctl start current
You shouldn't see any indication at the terminal that things have gone well (or otherwise), so it's a good idea to check current's status as follows;
sudo systemctl status current
We should see a report back that indicates (amongst other things) that 'current' is active and running.
Now we will enable it to start on boot.
sudo systemctl enable current
Integrate with Prometheus / Grafana
If you haven't used Prometheus and Grafana for monitoring before, let me take a moment to enthusiastically recommend it to you. Combined, they make a very powerful platform for checking up on your various pieces of IT and they are tools that are widely used in the outside world (in other words, the skills you build in using it are transferable). Better yet, they will run really well on a Raspberry Pi!
I'm not going to describe how to install both here, but I would recommend working your way through
this book which you can read online or download (for free) to step through the process.
Assuming you have an instance of Prometheus / Grafana available, we can add a custom exporter for monitoring our current as follows;
When implemented it will gather our information and expose it via a HTTP endpoint (the same way that Prometheus's node_exporter does with http://<IP Address>:9100/metrics.
Our metric name will reflect the type of thing that is being measured. You can see a range of good examples in the metrics exposed from node_exporter. For example 'cpu_frequency' and 'boot_time'. For our measurements we will have 'current'.
The last part of the name should describe the units being used for the measurement (in plural form). In our case the current will be in 'milliamps'.
The full name of our metrics will therefore be;
To use the custom exporter on our target machine (in this case the IP address of the Pi on the septic tank is 10.1.2.210), we’ll need to install the Prometheus client library for Python and pip as follows;
sudo apt-get install python-pip
pip install prometheus_client
To collect information, we need to make sure that we can gather it in a way that will suit our situation.
Our 'current' value is read by a Python script that is running in the background and writing the value to a file called 'current.txt'.
So, our python exporter script (which in this case is named
septic-exporter.py) looks like the following (this file is also
available from GitHub);
import prometheus_client
import time

UPDATE_PERIOD = 15

current = prometheus_client.Gauge('septic_current_milliamps',
            'Value relating to current flow with zero being effectivly nil.')

if __name__ == '__main__':
  prometheus_client.start_http_server(9999)

while True:
  with open('/home/pi/current.txt', 'r') as f:
    current_value = f.readline()
    try:
      float(current_value)
      current.set(float(current_value))
    except: pass

  time.sleep(UPDATE_PERIOD)
The main actions in our exporter can be summarized by the following entries:
- Import the Prometheus client Python library.
- Declare gauge metric with the metric name that we decided on earlier.
- Instantiate an HTTP server to expose metrics on port 9999.
- Start a measurement loop that will read our metric value every 15 seconds
- Gather our metric value from our text file.
In the same way that we made sure that our current measurement program starts up simply at boot, we will configure our Python exporter script as a service and have it start at boot.
The first step in this process is to create a service file which we will call septic_exporter.service. We will have this in the /etc/systemd/system/ directory.
sudo nano /etc/systemd/system/septic_exporter.service
Paste the following text into the file and save and exit (this file is also
available at GitHub).
[Unit]
Description=Septic Exporter
After=multi-user.target

[Service]
User=pi
ExecStart=/usr/bin/python /home/pi/septic-exporter.py

[Install]
WantedBy=multi-user.target
The service file can contain a wide range of configuration information and in our case there are only a few details. The most interesting being the 'ExecStart' details which describe where to find python and the septic-exporter.py executable.
Before starting our new service we will need to reload the systemd manager configuration again.
sudo systemctl daemon-reload
Now we can start the septic_exporter service.
sudo systemctl start septic_exporter
You shouldn't see any indication at the terminal that things have gone well, so it's a good idea to check septic_exporter's status as follows;
sudo systemctl status septic_exporter
We should see a report back that indicates (amongst other things) that septic_exporter is active and running.
Now we will enable it to start on boot.
sudo systemctl enable septic_exporter
The exporter is now working and listening on the port:9999
This should return a lot lot statistics. Some of them will look a little like this;
# HELP septic_current_milliamps Value relating to current flow with zero being effectivly nil.
# TYPE septic_current_milliamps gauge
septic_current_milliamps -520.0
There are a lot more metrics than just our septic info, but you can see our metrics there.
Now that we have a computer exporting metrics, we will want it to be gathered by Prometheus
Adding adding our custom exporter to Prometheus
We need to add the IP address of our new metrics source to the Prometheus prometheus.yml file. To do this we can simply add the IP address of a node that is running the septic_exporter as a new target and we are good to go.
On our Prometheus server;
nano /home/pi/prometheus/prometheus.yml
At the end of the file add the IP address of our new node - targets: ['10.1.2.210:9999'];
scrape_configs:
  # The job name is added as a label `job=<job_name>`
  # to any timeseries scraped from this config.
  - job_name: 'prometheus'

    # metrics_path defaults to '/metrics'
    # scheme defaults to 'http'.

    static_configs:
    - targets: ['localhost:9090']
    - targets: ['10.1.1.109:9100']
    - targets: ['10.1.2.210:9999']
Then we restart Prometheus to load our new configuration;
sudo systemctl restart prometheus
Now if we return to our Prometheus GUI to check which targets we are scraping we can see our new node at 10.1.2.210.
Make a graph in Grafana
Making sure that we can see what is happening with our sensor seems like a really good idea. Check out the book for
a good overview of the process, and for those who would like a very simple graph in json format for importing, there is one available in
GitHub here.
Add an alert
Part of the point for this entire project was that I wanted to know when the pump for the system was running for too long. Grafana and its alerting feature are the end game for that problem.
Alerts in Grafana allow us to set limits on our graphs such that when they are exceeded, we can send out notifications (for instance have one that indicated a drop in temperature that sent an alert to let you know to cover up delicate seedlings or an increase in used disk space that indicated a problem on a computer).
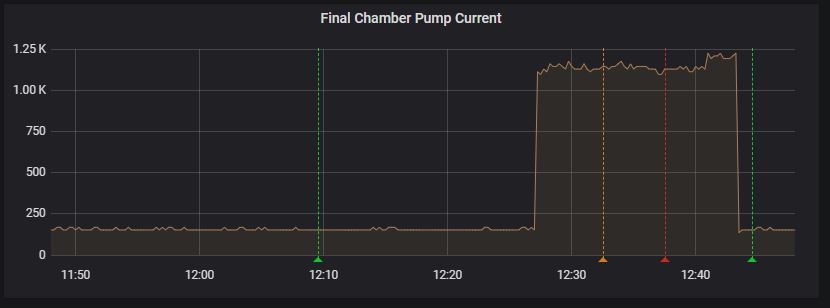
Looking at a graph of data that represents the operation of our pump (via the measurement of the current that it's drawing), we can set an alert that will trigger if our current draw goes above 1000 for more than 5 minutes (given that our pump will drain the final chamber in just under 2 minutes, this is a fair time).
Check out the
book to see an explanation for configuring Grafana to enable sending email alerts and for adding an alert to our graph. There is a Grafana panel saved in
GitHub that includes an alerting component.