Raspberry Pi Pico Tips and Tricks

Saturday 29 February 2020

Installing node_exporter for monitoring with Prometheus on a Raspberry Pi

The following decription of the installation of node_exporter is part of the book that can be found here on Leanpub (BTW, You can download it for free) on setting up a Raspberry Pi and installing / configuring Prometheus and Grafana.

Gathering metrics in Prometheus involves pulling data from providers via agents called ‘exporters’. There are a wide range of pre-built exporters and a range of templates for writing custom exporters which will collect data from your infrastructure and send it to Prometheus.

Node Exporter is the official exporter which exposes a wide variety of hardware- and kernel-related metrics like disk usage, CPU performance, memory state, etcetera for Linix systems. In the context of the following description of installation on a Raspberry Pi, it provides an incredible wealth of information.

Node Exporter

As node_exporter is an official exporter available from the Prometheus site, and as the binary is able to be installed standalone the installation process is fairly similar. We’ll download it, decompress it and run it as a service.
In the case of the installation below the node_exporter will be installed onto another Raspberry Pi operating on the local network at the IP address 10.1.1.109. It will pull our server metrics which will be things like RAM/disk/CPU utilization, network, io etc.
First then we will browse to the download page here - https://prometheus.io/download/#node_exporter. Remembering that it’s important that we select the correct architecture for our Raspberry Pi.
As the Pi that I’m going to monitor in this case with node_exporter uses a CPU based on the ARMv7 architecture, use the drop-down box to show armv7 options.
Note the name or copy the URL for the node_exporter file that is presented. The full URL in this case is something like - https://github.com/prometheus/node_exporter/releases/download/v0.18.1/node_exporter-0.18.1.linux-armv7.tar.gz;
Using a terminal, ssh into the node to be monitored. In our case, this swill be as the pi user again on 10.1.1.109.
Once safely logged in and at the pi users’s home directory we can start the download;
The file that is downloaded is compressed so once the download is finished we will want to expand our file. For this we use the tar command;
Housekeeping time again. Remove the original compressed file with the rm (remove) command;
We now have a directory called node_exporter-0.18.1.linux-armv7. Again, for the purposes of simplicity it will be easier to deal with a directory with a simpler name. We will therefore use the mv (move) command to rename the directory to just ‘grafana’ thusly;
Again, now we need to make sure that node_exporter starts up simply at boot. We will do this by setting it up as a service so that it can be easily managed and started.
The first step in this process is to create a service file which we will call node_exporter.service. We will have this in the /etc/systemd/system/ directory.
Paste the following text into the file and save and exit.
[Unit]
Description=Node Exporter
Wants=network-online.target
After=network-online.target

[Service]
User=pi
ExecStart=/home/pi/node_exporter/node_exporter

[Install]
WantedBy=default.target
The service file can contain a wide range of configuration information and in our case there are only a few details. The most interesting being the ‘ExecStart’ details which describe where to find the node_exporter executable.
Before starting our new service we will need to reload the systemd manager configuration again.
Now we can start the node_exporter service.
You shouldn’t see any indication at the terminal that things have gone well, so it’s a good idea to check node_exporter’s status as follows;
We should see a report back that indicates (amongst other things) that node_exporter is active and running.
Now we will enable it to start on boot.
The exporter is now working and listening on the port:9100
To test the proper functioning of this service, use a browser with the url: http://10.1.1.109:9100/metrics
This should return a lot lot statistics. They will look a little like this
# HELP go_gc_duration_seconds A summary of the GC invocation durations.
# TYPE go_gc_duration_seconds summary
go_gc_duration_seconds{quantile="0"} 0
go_gc_duration_seconds{quantile="0.25"} 0
go_gc_duration_seconds{quantile="0.5"} 0
go_gc_duration_seconds{quantile="0.75"} 0
go_gc_duration_seconds{quantile="1"} 0
go_gc_duration_seconds_sum 0
go_gc_duration_seconds_count 0
# HELP go_goroutines Number of goroutines that currently exist.
# TYPE go_goroutines gauge
go_goroutines 6
# HELP go_info Information about the Go environment.
# TYPE go_info gauge
go_info{version="go1.12.5"} 1
Now that we have a computer exporting metrics, we will want it to be gathered by Prometheus

Prometheus Collector Configuration

Prometheus configuration is via a YAML (Yet Another Markup Language) file. The Prometheus installation comes with a sample configuration in a file called prometheus.yml (in our case in /home/pi/prometheus/).
The default file contains the following;
# my global config
global:
  scrape_interval:     15s # Set the scrape interval
  evaluation_interval: 15s # Evaluate rules every 15 seconds
  # scrape_timeout is set to the global default (10s).

# Alertmanager configuration
alerting:
  alertmanagers:
  - static_configs:
    - targets:
      # - alertmanager:9093

# Load rules once and periodically evaluate them
# according to the global 'evaluation_interval'.
rule_files:
  # - "first_rules.yml"
  # - "second_rules.yml"

# A scrape configuration containing one endpoint to scrape:
# Here it's Prometheus itself.
scrape_configs:
  # The job name is added as a label `job=<job_name>`
  # to any timeseries scraped from this config.
  - job_name: 'prometheus'

    # metrics_path defaults to '/metrics'
    # scheme defaults to 'http'.

    static_configs:
    - targets: ['localhost:9090']
There are four blocks of configuration in the example configuration file: global, alerting, rule_files, and scrape_configs.

global

The global block controls the Prometheus server’s global configuration. In the default example there are two options present. The first, scrape_interval, controls how often Prometheus will scrape targets. We can still override this for individual targets. In this case the global setting is to scrape every 15 seconds. The evaluation_interval option controls how often Prometheus will evaluate rules. Prometheus uses rules to create new time series and to generate alerts. The global settings also serve as defaults for other configuration sections.
The global options are;
  • scrape_interval: How frequently to scrape targets. The default = 1m
  • scrape_timeout: How long until a scrape request times out. The default = 10s ]
  • evaluation_interval: How frequently to evaluate rules. The default = 1m ]
  • external_labels: The labels to add to any time series or alerts when communicating with external systems (federation, remote storage, Alertmanager)

alerting

The alerting section allows for the integration of alerts from Prometheus. In the default config above there are none set up and conveniently we are going to look at alerting from Grafana instead. So we can safely leave this alone.

rule_files

The rule_files block specifies the location of any rules we want the Prometheus server to load. For now we’ve got no rules. These recording rules allow Prometheus to evaluate PromQL expressions regularly and ingest their results. Recording rules go in separate files from our prometheus.yml file. They are known as rule files. We won’t be covering these in our examples in this book.

scrape_configs

The last block, scrape_configs, controls what resources Prometheus monitors. In our default case, only one scrape configuration exists that specifies a single job. In advanced configurations, this may be different. Since Prometheus also exposes data about itself it can scrape and monitor its own health. We can see that in the last line, - targets: ['localhost:9090']. In the default configuration there is a single job, called prometheus, which scrapes the time series data exposed by the Prometheus server. The job contains a single, statically configured, target, the localhost on port 9090. Prometheus expects metrics to be available on targets on a path of /metrics. So this default job is scraping via the URL: http://localhost:9090/metrics.
In our simplest means of adding metrics to Prometheus, we can add additional targts to this list.

Adding a monitoring node to Prometheus

In keeping with the information on the prometheus.yml file, we can simply add the IP address of a node that is running the node_exporter as a new target and we are good to go.
Let’s add the node that we configured in the previous section at 10.1.1.109.
At the end of the file add the IP address of our new node - targets: ['10.1.1.109:9100'];
scrape_configs:
  # The job name is added as a label `job=<job_name>`
  # to any timeseries scraped from this config.
  - job_name: 'prometheus'

    # metrics_path defaults to '/metrics'
    # scheme defaults to 'http'.

    static_configs:
    - targets: ['localhost:9090']
    - targets: ['10.1.1.109:9100']
Then we restart Prometheus to load our new configuration;
sudo systemctl restart prometheus
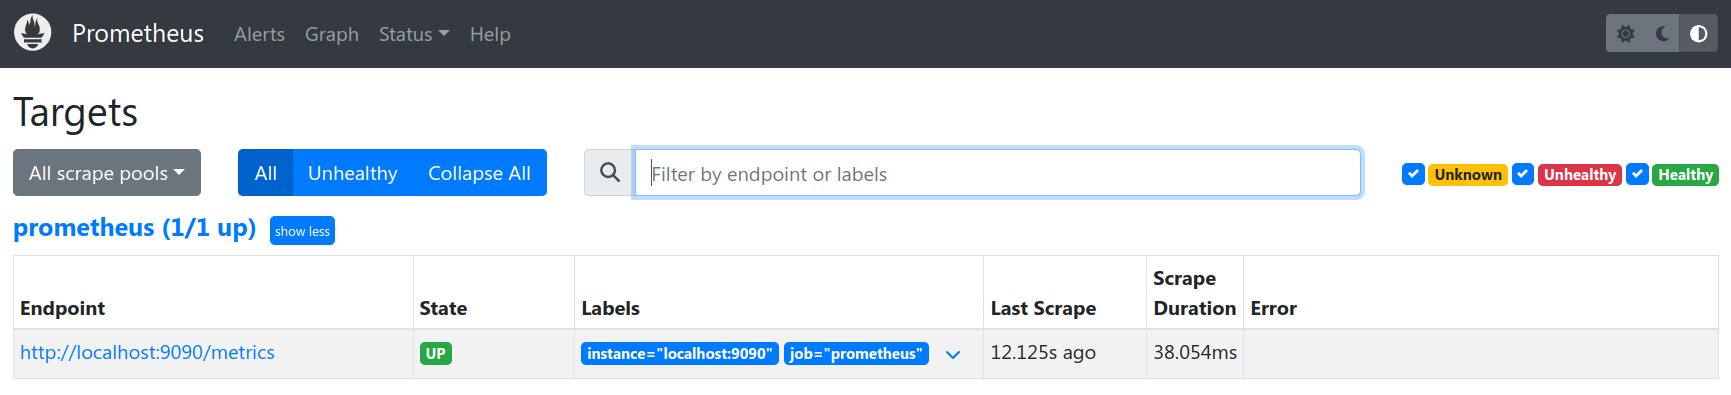
Now if we return to our Prometheus GUI (http://10.1.1.110:9090/targets) to check which targets we are scraping we can see two targets, including our new node at 10.1.1.109.
Grafana login
Grafana login

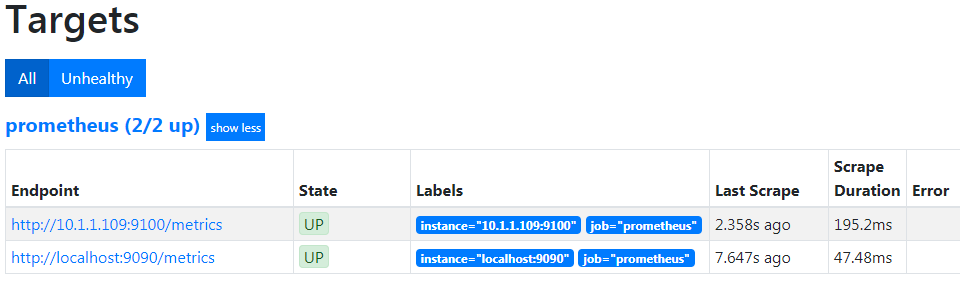
Let’s see our new node in Grafana!

Because we have already added Prometheus as a data source in Grafana, seeing or new node in a dashboard is ridiculously simple.
Go back to our Grafana GUI at http://10.1.1.110:3000.
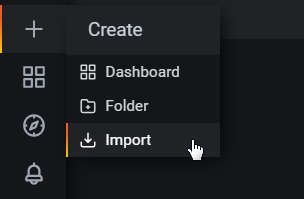
Select the create icon which is the plus (‘+’) sign on the left hand side of the screen and then select ‘Import’.
Import Dashboard
Import Dashboard
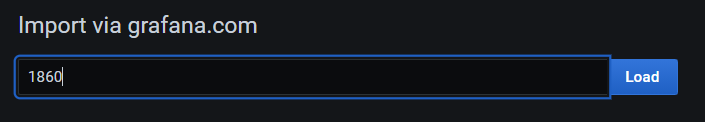
In the Grafana.com Dashboard box enter the dashboard number 1860.
Import Dashboard 1860
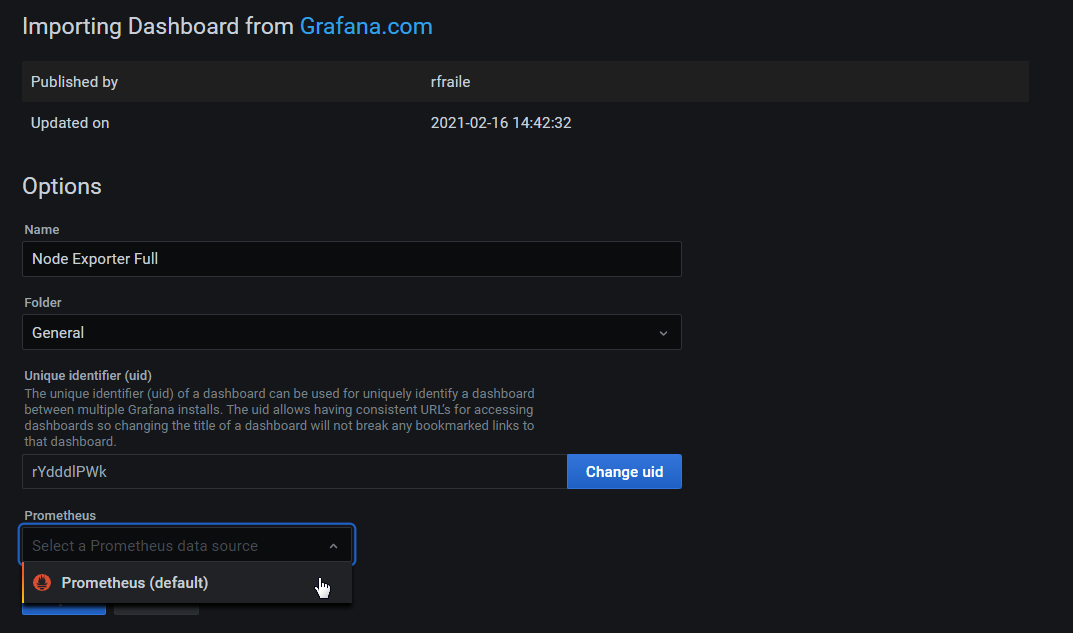
Under the prometheus Option use the drop-down arrow and select ‘Prometheus’.
Then click on ‘Import’.
Import Dashboard 1860
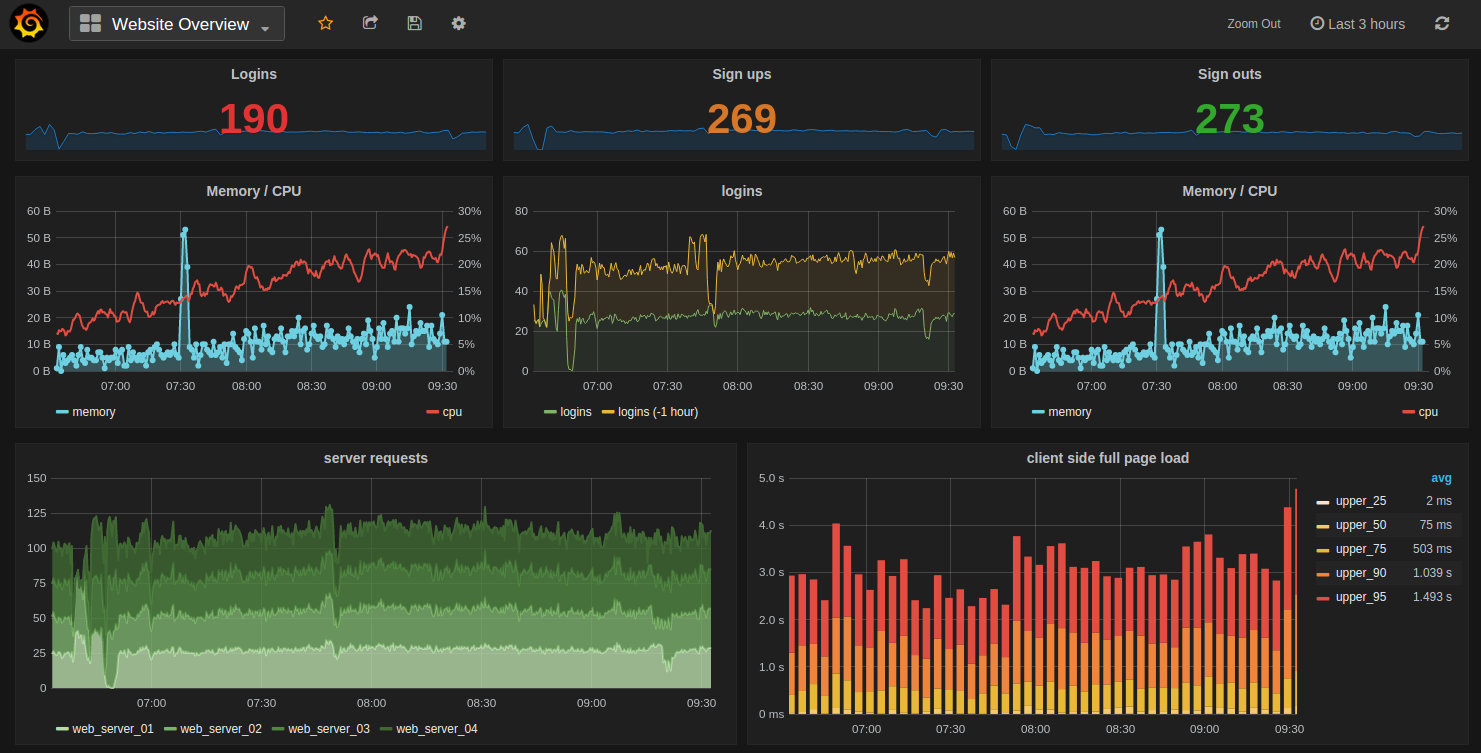
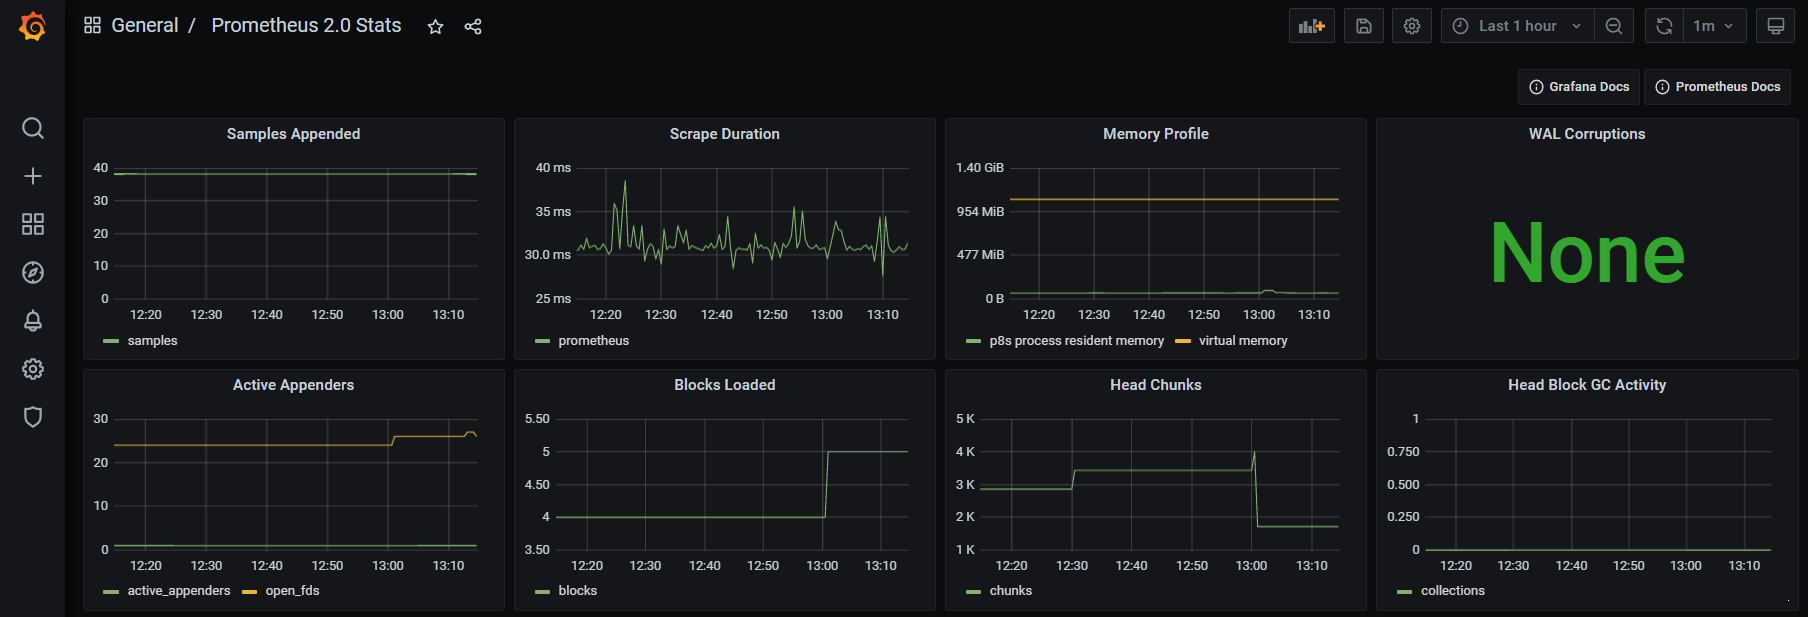
The dashboard should now be there in all its glory
Import Dashboard 1860
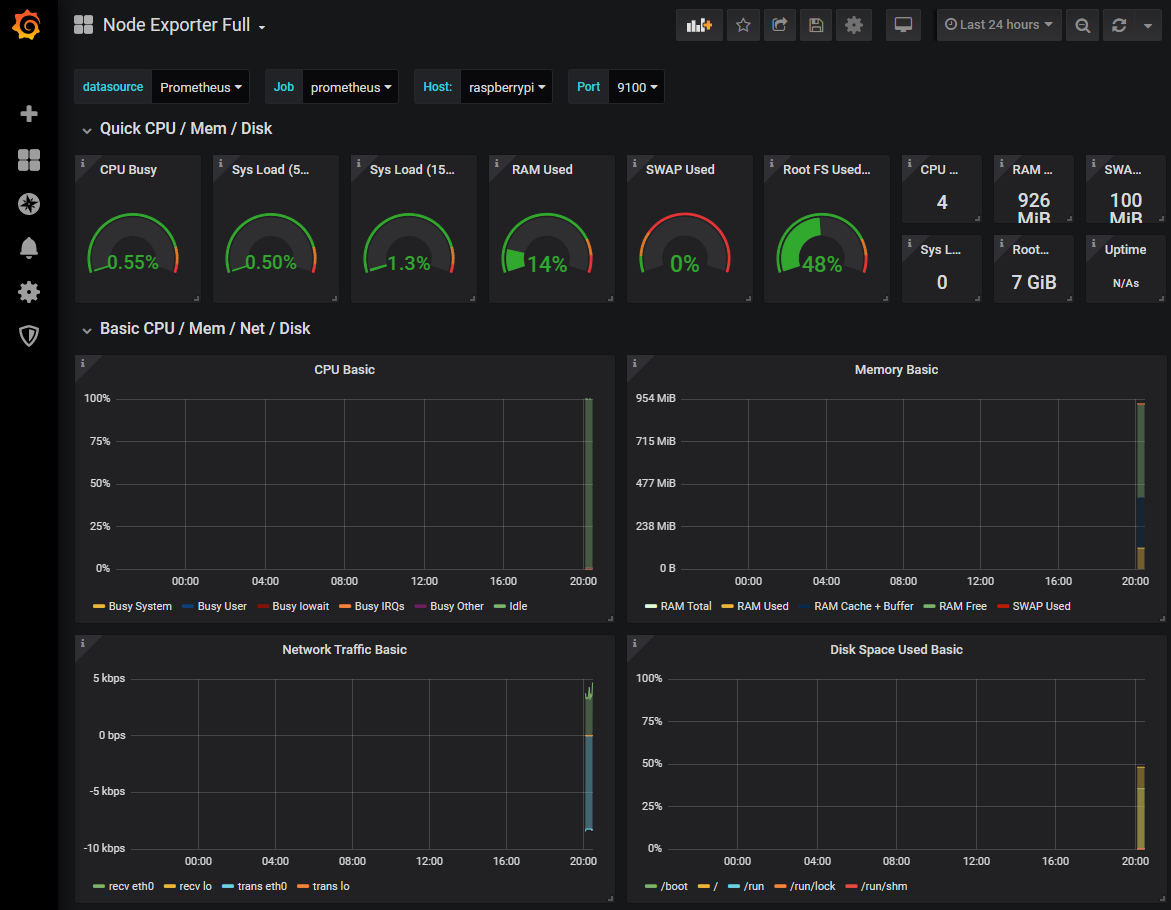
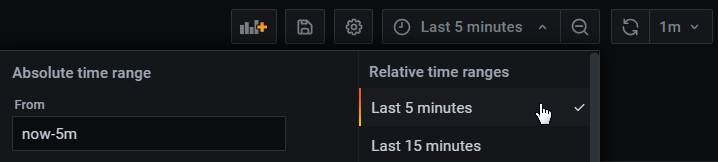
At this stage there probably won’t be much to see, but we can shorten the displayed time to the past 5 minutes by using the custom time range menu at the top right of the screen.
Import Dashboard 1860
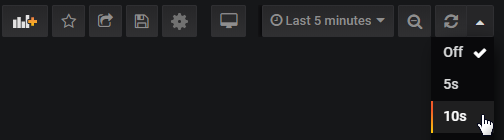
To keep the screen updating select the auto-refresh setting from the top right hand corner. In the screenshot below we are selecting 10 seconds.
Import Dashboard 1860
The end result is an automatically updating indication of the performance of our Raspberry Pi at 10.1.1.109.
Import Dashboard 1860

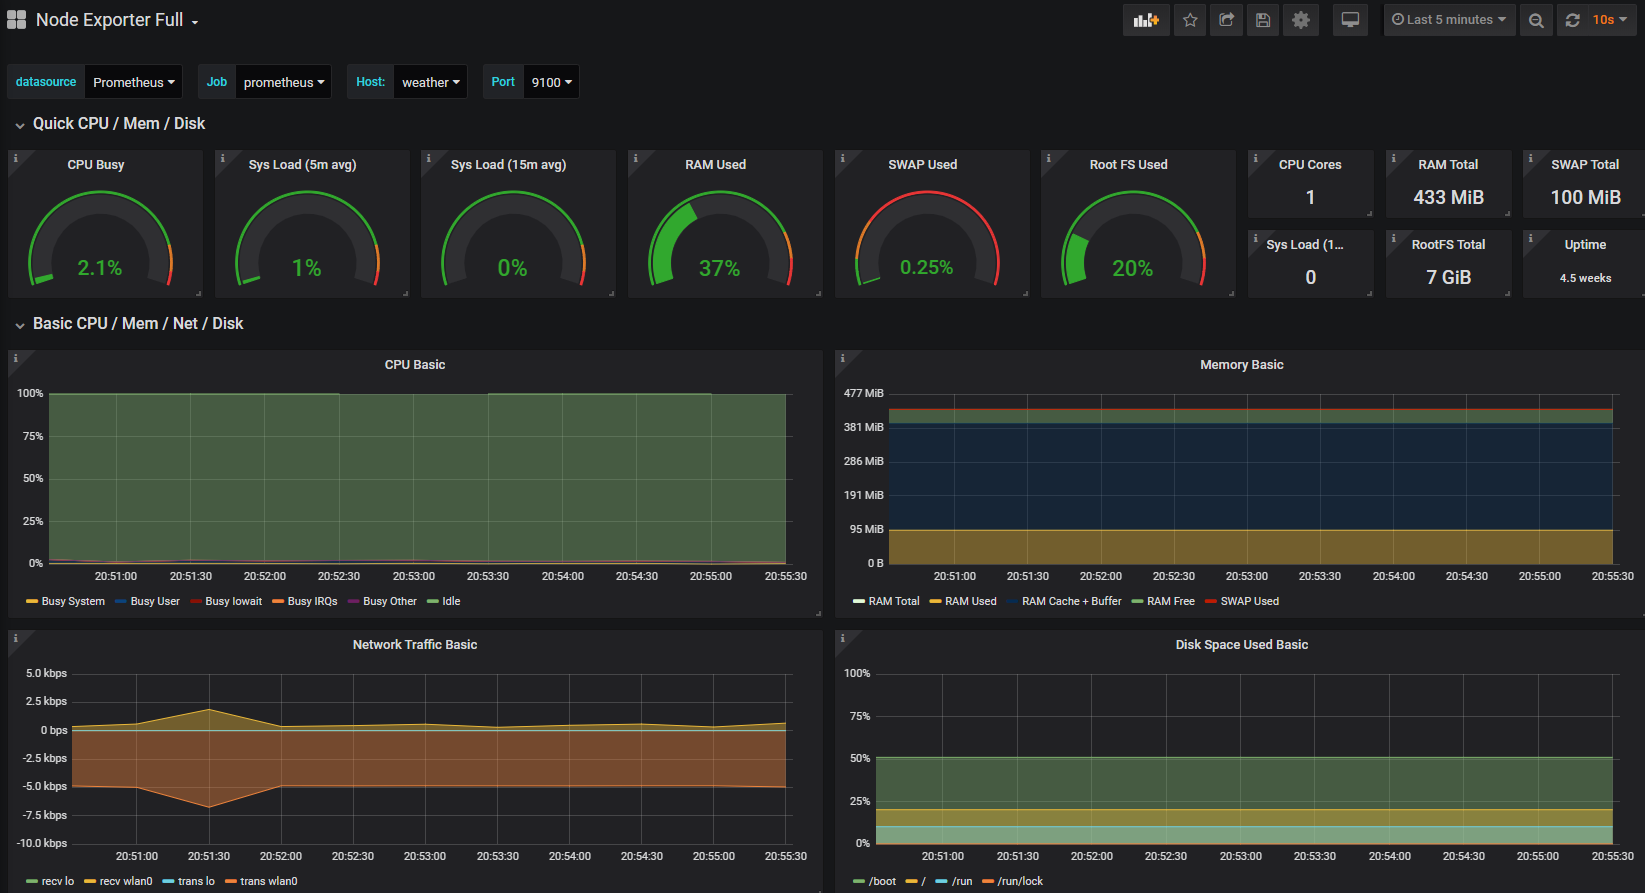
Take a few minutes to explore the additional panels at the bottom of the screen. This is a manifestation of the huge number of metrics that we saw in text form when we tested the scraping of the node_exporter installation, brought to life in graphical form.
------------------------------------------

Remenber, the decription above of the installation of node_exporter is part of the book that can be downloaded for free here on Leanpub. The full book has a lot more context for the installation.

Friday 21 February 2020

Installing Prometheus and Grafana on a Raspberry Pi

Recently I've gone through something of a revelation. I'm a fan of the Raspberry Pi (duh!) and I'm a fan of connecting them and presenting the data from sensors. I've used the experience that I have with d3.js to present collected data and even written a standalone monitoring system that I really enjoyed.

However, I was intoduced to Prometheus and Grafana recently and pretty early on in the process I could see that I was re-inventing the wheel for monitoring. The combination of the two of them created a very polished experience. As a result, I dove in as I will normall do and wrote a book (you can download it for free by the way) outlining the process for setting up a Raspberry Pi and installing / configuring Prometheus and Grafana.

Below you can find the steps that I took.
About Prometheus
Prometheus is an open source application used for monitoring and alerting. It records real-time metrics in a time series database built using a HTTP pull model.
It is licensed under the Apache 2 License, with source code available on GitHub.
It was was created because of the need to monitor multiple microservices that might be running in a system. It employs a modular architecture and employs modules called exporters, which allow the capture of metrics from a range of platforms, IT hardware and software. Prometheus is written with easily distributed binaries which allow it to run standalone with no external dependencies.
Prometheus’s ‘pull model’ of metrics gathering means that it will actively request information for recording. The alternative (and both have strengths) is a ‘push model’ which occurs when information is pushed to a recording service without being asked. InfluxDB is a popular piece of software that employs that model.
Prometheus collects metrics at regular intervals and stores them locally. These metrics are pulled from nodes that run ‘exporters’. An exporter can be defined as a module that extracts information and translates it into the Prometheus format.
Prometheus has an alert manager that can notify a follow on end point if something is awry and it has a visualisation component that is useful for testing. However, it is commonly used in combination with the Grafana platform which has a very powerful visualisation capability.
Prometheus data is stored as metrics, with each having a name that is used for referencing and querying. This is what makes it very good at recording time series data. To add dimensionality, each metric can be drilled down by an arbitrary number of key=value pairs (labels). Labels can include information on the data source and other application-specific information.

About Grafana


Grafana is an open-source, general purpose dashboard and visualisation tool, which runs as a web application. It supports a range of data inputs such as InfluxDB or Prometheus.
It allows you to visualize and alert on your metrics as well as allowing for the creation of dynamic & reusable dashboards.
Grafana is open source and covered by the Apache 2.0 license and its source code is available on GitHub.
Three of the primary strengths of Grafana are;
  1. A powerful engine for the building of dashboards that can contain a wide range of different visualisation techniques.
  2. The ability to display dynamic data from multiple sources in a way that allows for multi-dimensional integration.
  3. An alerting engine that provides the ability to attach rules to dashboard panels. These rules provide the facility to trigger alerts and notifications.
Imported Dashboard
Imported Dashboard

Installation

While the Raspberry Pi comes with a range of software already installed on the Raspbian distribution (even the Lite version) we will need to download and install Prometheus and Grafana separately
If you’re sneakily starting reading from this point, make sure that you update and upgrade Raspbian before continuing.

Installing Prometheus

The first thing that we will want to do before installing Prometheus is to determine what the latest version is. To do this browse to the download page here - https://prometheus.io/download/. There are a number of different software packages available, but it’s important before looking at any of them that we select the correct architecture for our Raspberry Pi. As the Pi 4 (which I’m using for this install) uses a CPU based on the Arm v7 architecture, use the drop-down box to show armv7 options.
Note the name or copy the URL for the file that is presented. On the 6th of January, the version that was available was 2.15.2. The full URL was something like;
https://github.com/prometheus/prometheus/releases/download/v2.15.2/prometheus-2.15.2.linux-armv7.tar.gz. 
We can see that ‘armv7’ is even in the name. That’s a great way to confirm that we’re on the right track.
On our Pi we will start the process in the pi users home directory (/home/pi/). We will initiate the download process with the wget command as follows ;
The file that is downloaded is compressed so once the download is finished we will want to expand our file. For this we use the tar command;
Let’s do some housekeeping and remove the original compressed file with the rm (remove) command;
We now have a directory called prometheus-2.15.2.linux-armv7. While that’s nice and descriptive, for the purposes of simplicity it will be easier to deal with a directory with a simpler name. We will therefore use the mv (move) command to rename the directory to just ‘prometheus’ thusly;
Believe it or not, that is as hard as the installation gets. Everything from here is configuration in one form or another. However, the first part of that involves making sure that Prometheus starts up simply at boot. We will do this by setting it up as a service so that it can be easily managed and started.
The first step in this process is to create a service file which we will call prometheus.service. We will have this in the /etc/systemd/system/ directory.
Paste the following text into the file and save and exit.
[Unit]
Description=Prometheus Server
Documentation=https://prometheus.io/docs/introduction/overview/
After=network-online.target

[Service]
User=pi
Restart=on-failure

#Change this line if Prometheus is somewhere different
ExecStart=/home/pi/prometheus/prometheus \
  --config.file=/home/pi/prometheus/prometheus.yml \
  --storage.tsdb.path=/home/pi/prometheus/data

[Install]
WantedBy=multi-user.target
The service file can contain a wide range of configuration information and in our case there are only a few details. The most interesting being the ‘ExecStart’ details which describe where to find the prometheus executable and what options it should use when starting. In particular we should note the location of the prometheus.yml file which we will use in the future when adding things to monitor to Prometheus.
Before starting our new service we will need to reload the systemd manager configuration. This essentially takes changed configurations from our file system and makes them ready to be used. We have added a service, so systemd needs to know about it before it can start it.
Now we can start the Prometheus service. .
You shouldn’t see any indication at the terminal that things have gone well, so it’s a good idea to check Prometheus’s status as follows;
We should see a report back that indicates (amongst other things) that Prometheus is active and running.
Now we will enable it to start on boot.
To check that this is all working well we can use a browser to verify that Prometheus is serving metrics about itself by navigating to its own metrics endpoint at http://10.1.1.110:9090/metrics (or at least at the IP address of your installation).
A long list of information should be presented in the browser that will look a little like the following;
# HELP go_gc_duration_seconds A summary of the GC invocation durations.
# TYPE go_gc_duration_seconds summary
go_gc_duration_seconds{quantile="0"} 4.4297e-05
go_gc_duration_seconds{quantile="0.25"} 5.476e-05
go_gc_duration_seconds{quantile="0.5"} 0.000157445
go_gc_duration_seconds{quantile="0.75"} 0.000249149
go_gc_duration_seconds{quantile="1"} 0.000375409
go_gc_duration_seconds_sum 0.001187673
go_gc_duration_seconds_count 7
# HELP go_goroutines Number of goroutines that currently exist.
# TYPE go_goroutines gauge
go_goroutines 47
# HELP go_info Information about the Go environment.
# TYPE go_info gauge
go_info{version="go1.13.5"} 1
We can now go to a browser and enter the IP address of our installation with the port :9090 to confirm that Prometheus is operating. In our case that’s http://10.1.1.110:9090.
Grafana login
Grafana login
If we now go to the ‘Status’ drop down menu and select ‘Targets’ we can see the list of targets that Prometheus is currently scraping metrics from.
Grafana login
Grafana login
From the information above, we can see that it is already including itself as a metric monitoring point!
There’s still plenty more to do on configuring Prometheus (specifically setting up exporters), but for the mean time we will leave the process here and set up Grafana.

Installing Grafana

In much the same way that we installed Prometheus, the first thing we need to do is to find the right version of Grafana to download. To do this browse to the download page here - https://grafana.com/grafana/download?platform=arm. There are a number of different ways to install Grafana. We are going to opt for the simple method of installing a standalone binary in much the same way that we installed Prometheus.
The download page noted above goes straight to the ARM download page. We will be looking for the ‘Standalone Linux Binaries’ for ARMv7. Note the name or copy the URL for the file that is presented. On the 24th of January, the version that was available was 6.5.3. The full URL was something like https://dl.grafana.com/oss/release/grafana-6.5.3.linux-armv7.tar.gz;
On our Pi we will start the process in the pi users home directory (/home/pi/). We will initiate the download process with the wget command as follows (the command below will break across lines, don’t just copy - paste it);
The file that is downloaded is compressed so once the download is finished we will want to expand our file. For this we use the tar command;
Housekeeping time again. Remove the original compressed file with the rm (remove) command;
We now have a directory called grafana-6.5.3. While that’s nice and descriptive, for the purposes of simplicity it will be easier to deal with a directory with a simpler name. We will therefore use the mv (move) command to rename the directory to just ‘grafana’ thusly;
Again, now we need to make sure that Grafana starts up simply at boot. We will do this by setting it up as a service so that it can be easily managed and started.
The first step in this process is to create a service file which we will call grafana.service. We will have this in the /etc/systemd/system/ directory.
Paste the following text into the file and save and exit.
[Unit]
Description=Grafana Server
After=network.target

[Service]
Type=simple
User=pi
ExecStart=/home/pi/grafana/bin/grafana-server
WorkingDirectory=/home/pi/grafana/
Restart=always
RestartSec=10

[Install]
WantedBy=multi-user.target
The service file can contain a wide range of configuration information and in our case there are only a few details. The most interesting being the ‘ExecStart’ details which describe where to find the Grafana executable.
Before starting our new service we will need to reload the systemd manager configuration again.
Now we can start the Grafana service.
You shouldn’t see any indication at the terminal that things have gone well, so it’s a good idea to check Grafana’s status as follows;
We should see a report back that indicates (amongst other things) that Grafana is active and running.
Now we will enable it to start on boot.
At this point we have Grafana installed and configured to start on boot. Let’s start exploring!
Using a browser, connect to the Grafana server: http://10.1.1.110:3000.
Grafana login
Grafana login
The account and password are: admin/admin. Grafana will ask you to change this password.
The first configuration to be made will be to create a data source that Grafana will use to collect metrics. Of course, this will be our Prometheus instance
Go to the configuration menu (the little gear icon) and select ‘Data Sources’.
Data Sources Menu
Data Sources Menu
The select ‘Add Data Source’ and then select Prometheus as that data source.
Add Data Source
Add Data Source
Now we get to configure some of the settings for our connection to Prometheus.
In this case we can set the URL as ‘http://localhost:9090’ (since both Prometheus and Grafana are installed on the same server), the scrape interval as ’15s’, the Query timeout as 60s and the http method as ‘GET’.
Then click on the ‘Save & Test button’.
Save & Test
Save & Test
We should get some nice ticks to indicate that the data source is working.
Data Sources Tick
Data Sources Tick
Great!
Now things start to get just a little bit exciting. Remember the metrics that were being sent out by Prometheus? Those were the metrics that report back on how Prometheus is operating. In other words, it’s the monitoring system being monitored. We are going to use that to show our first dashboard.
Here lies another strength of Grafana. Dashboards can be built and shared by users so that everyone benefits. We will import one such dashboard to show us how Prometheus is operating.
At the top of our ‘Data Sources / Prometheus’ settings screen there is a ‘Dashboards tab. Click on that to show some available dashboards for our Prometheus instance;
Import Prometheus Dashboard
Click on the ‘Import’ button for the ‘Prometheus 2.0 Stats’ dashboard. We should recieve a little green tick notification telling us that it has been successful. Now click on the ‘Prometheus 2.0 Stats’ label itself and the dashboard will open.
First Dashboard
First Dashboard
How about that?
We should now be looking at a range of metrics that Grafana is scraping from Prometheus and presenting in a nice fashion.
Trust me, this is just the start of our journey. As simple as the process of getting up and running and looking at a pretty graph is, there are plenty more pleasant surprises to come as we look at the flexibility and power of these two services.